Price Prediction")
Hedera (HBAR) entered the Layer 1 segment with an institutional governance structure and a clear enterprise mandate. An established council oversees network decisions, and its throughput and fee model target high-volume settlement use cases. In theory, that architecture should support sustained demand. In practice, valuation has trailed those ambitions across multiple cycles. So the real question is structural. Can enterprise activity translate into consistent token demand that absorbs supply and attracts capital at scale? And across 2026, 2030, and 2040, what conditions would justify a path toward $1? Any serious projection must incorporate dilution, market cap limits, and competitive Layer 1 positioning.
What Is HBAR?
HBAR is the native asset of Hedera, a decentralized public network built on Hashgraph technology. The network uses a directed acyclic graph structure to achieve high throughput, fast finality, and consistent transaction ordering. Governance operates through a council of global enterprises that oversee node operation and network direction. This model aims to support payments, tokenization, and data integrity at scale.HBAR functions as the network’s fuel. It pays transaction fees and supports consensus through staking. The maximum supply is capped at 50 billion tokens, with distribution scheduled over time. Circulating supply expansion directly affects valuation math. For the price to rise across multiple cycles, demand must outpace token release.
HBAR Price History
HBAR entered exchanges in 2019 during a period of rising interest in alternative Layer 1 networks. Early pricing reflected allocation into high-throughput infrastructure narratives. Then, 2021 marked its strongest expansion phase. During that cycle, HBAR reached an all-time high above $0.56 in mid-September, driven largely by broad market participation rather than project-specific demand. However, the following phase brought sector-wide repricing. As capital conditions tightened, HBAR declined significantly, at one point trading near $0.035 in late 2022 before stabilizing in later periods. Meanwhile, token distribution continued.
As of early 2026, roughly 43 billion of the 50 billion maximum supply is already circulating, which reduces future issuance but keeps supply pressure part of the valuation equation. That supply base defines the valuation starting point for forward projections.
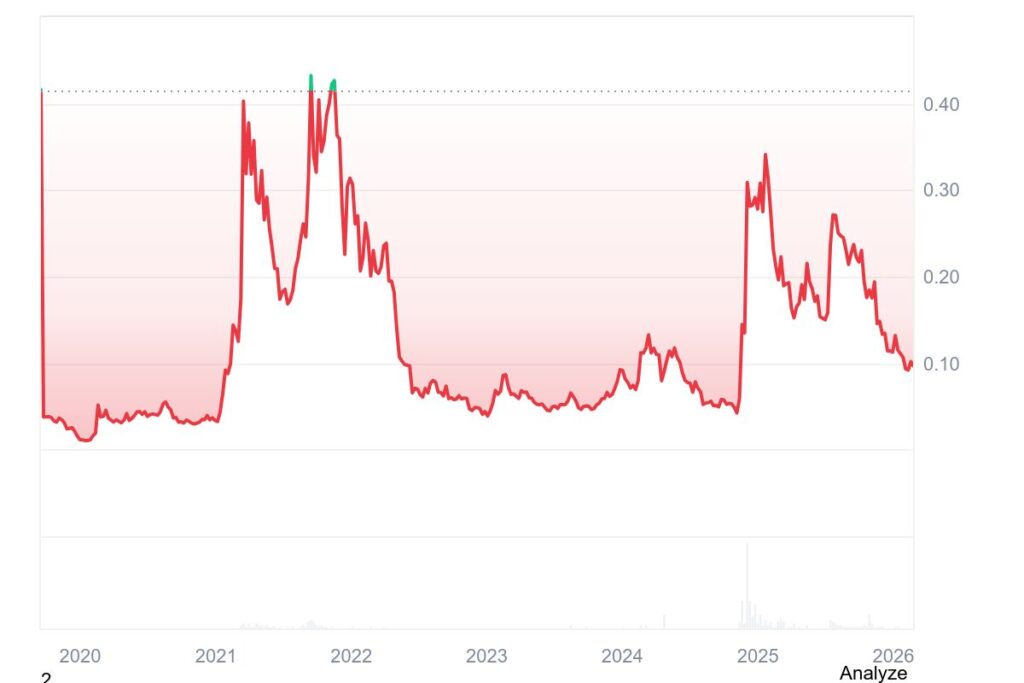
ALT: HBAR price chart showing 2020-2026 volatility
HBAR Price Prediction for 2026.
According to CoinCodex, here is how the year may develop across quarters.
Q1 2026 (January-March)
February projections place the average near $0.11. HBAR might be trading up to $0.16 in March, with highs near $0.18. That move reflects increased allocation after prior compression. Still, early gains must hold above established support to confirm continuation. Without sustained demand, the range could narrow quickly.
Q2 2026 (April-June)
April and May projections extend between $0.19–$0.22. June pulls back closer to the $0.15–$0.16 range. This sequence signals a test of conviction. For higher levels to persist, transaction activity and broader Layer 1 allocation must align. Otherwise, capital may rotate into competing ecosystems.
Q3 2026 (July-September)
Average prices are expected to be near $0.15–$0.16, with highs around $0.17–$0.18. This compression phase can indicate a balance between buyers and sellers. During such periods, sustained positioning matters more than brief spikes.
Q4 2026 (October-December)
The final quarter shows projected averages near $0.12–$0.13, with highs below earlier peaks. That range places emphasis on capital discipline. For expansion to resume, demand must consistently exceed available supply. Otherwise, HBAR may close the year within a narrower valuation band.
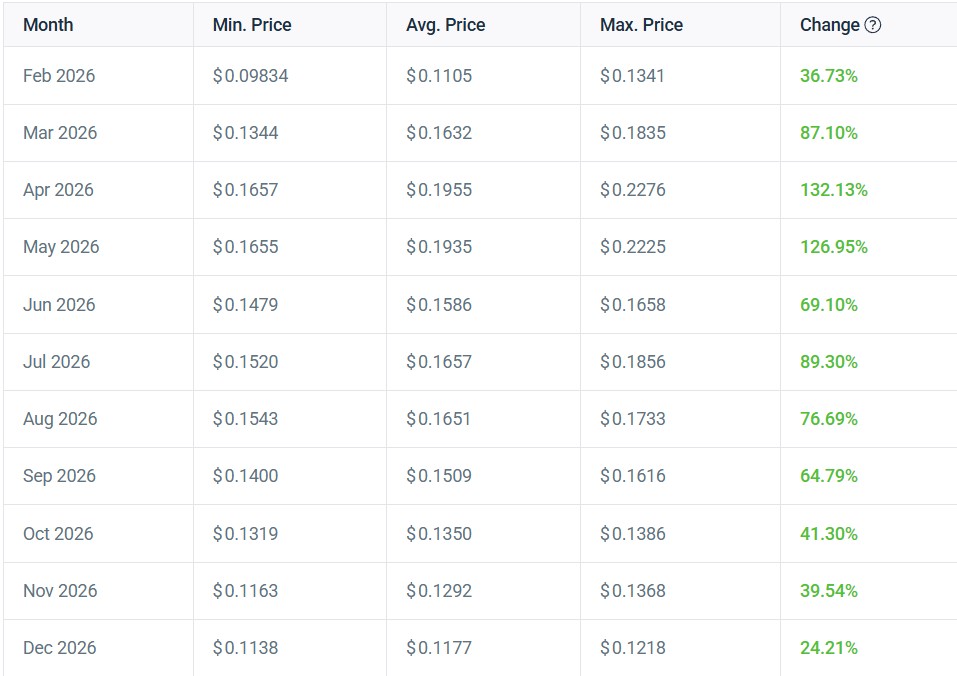
ALT: HBAR 2026 monthly price forecast table
HBAR Price Prediction for 2030
By 2030, price should indicate whether Hedera has secured a durable place across at least one full market cycle. CoinCodex projections provide a reference for how capital participation and network traction may influence valuation during the year.
Q1-Q2 2030 (January-June)
CoinCodex forecasts show averages between $0.23 and $0.29 during the first half, with May near $0.29 maximum. That range implies deeper investor engagement relative to prior compression phases. Holding those levels will depend on sustained token demand. HBAR’s standing within the Layer 1 segment hinges on whether enterprise activity generates consistent transaction volume that absorbs circulating supply. If capital continues to engage and participation remains broad, the mid-$0.20 area could form a credible base.
Q3-Q4 2030 (July-December)
Hedera is expected to move near $0.26–$0.27, with highs near $0.28. This compression points to a balance between buyers and sellers. Staking participation and circulating supply trends will influence stability. Institutional allocation patterns will also matter, especially if capital concentrates within a small group of dominant Layer 1 assets. Sustained positioning above the mid-$0.20 range would require steady demand absorption.
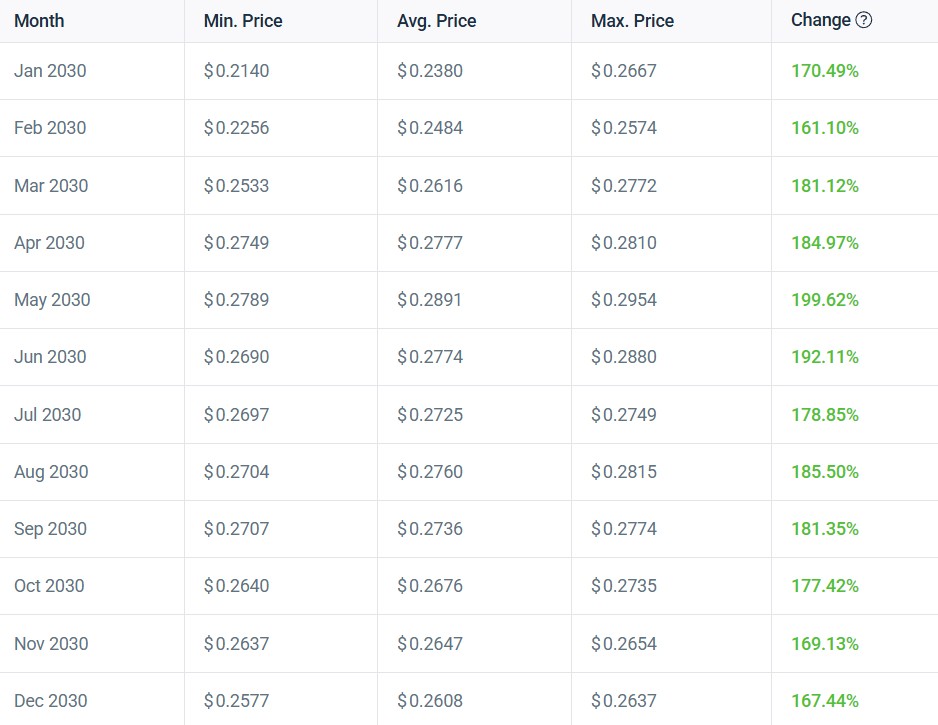
ALT: HBAR 2030 monthly price forecast table
HBAR Price Prediction for 2040
By 2040, the discussion moves beyond cycle timing and into survivorship. CoinCodex projections place average prices near $0.41–$0.46. That band implies long-term relevance, though far from extreme upside scenarios. For HBAR to sustain those levels, infrastructure use must extend beyond pilot programs into recurring settlement activity. Regulatory clarity over the decade would need to support enterprise adoption without restricting token usage. Institutional participation would also play a larger role, especially if digital assets become integrated into broader capital markets. A move significantly beyond the projected range would require demand strong enough to absorb the circulating supply across multiple cycles. That means sustained allocation, consistent transaction volume, and competitive positioning within the Layer 1 segment.
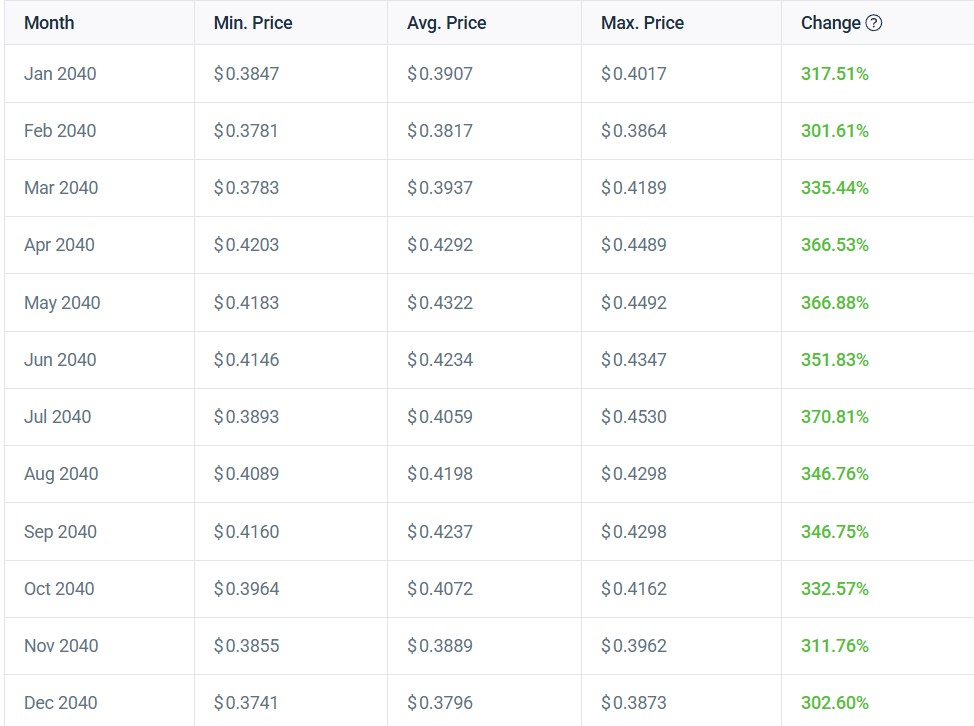
ALT: HBAR 2040 monthly price forecast table
Will Hedera Reach $1?
Start with simple math. With roughly 43 billion tokens in circulation, a $1 price implies a market capitalization of nearly $43 billion. That figure must be evaluated against prior crypto market peaks and the capital allocated to leading Layer 1 networks during expansion phases. At previous cycle highs, only a handful of infrastructure assets sustained valuations at that scale. So the question becomes comparative. Would HBAR command allocation be similar to dominant smart contract platforms, or remain in the mid-cap tier?
Supply dynamics also matter. Although most tokens are already circulating, remaining distribution and staking behavior influence effective sell pressure. For $1 to hold, demand must absorb available token floats across multiple quarters. Therefore, $1 is mathematically possible. However, the probability depends on durable multi-cycle participation, competitive positioning, and meaningful capital expansion.
Key Growth Drivers for HBAR
Long-term valuation depends on demand that can absorb the circulating supply across cycles. The following factors carry the most weight.
- Enterprise adoption scaling into measurable token demand: Enterprise partnerships matter only if they generate consistent transaction volume paid in HBAR. Recurring fee usage and staking participation would signal real demand rather than symbolic alignment.
- Stablecoin and tokenization growth on Hedera: If stablecoin issuance and asset tokenization expand on the network, transaction throughput can rise structurally. That activity must translate into fee generation that supports sustained token usage.
- Governing council expansion: Additional council members may reinforce institutional credibility. However, valuation impact depends on whether those entities drive network utilization.
- Institutional custody and ETF inclusion: Access through regulated custody or exchange-traded products can broaden capital participation. Broader access can improve allocation depth across cycles.
- Broader crypto market expansion: A larger overall market increases the capital pool available for infrastructure assets. HBAR would need to capture a meaningful share of that allocation.
- Supply stabilization: As distribution approaches completion, reduced incremental issuance can ease sell pressure and support valuation resilience.
Risks That Could Limit HBAR’s Upside
The primary structural risks include:
- Supply unlock pressure: Although most tokens are circulating, remaining releases can still add incremental sell pressure. Price strength requires demand that consistently absorbs the supply.
- Competition from other high-throughput chains: Capital allocates selectively across Layer 1 assets. If competing networks capture developer activity and transaction volume, HBAR may struggle to gain allocation share.
- Regulatory classification risk: Adverse classification could restrict exchange access or institutional exposure. Reduced access can limit capital depth.
- Insufficient retail engagement: Infrastructure narratives alone may not attract broad participation. Without sustained interest, valuation expansion becomes harder to maintain.
- Enterprise use without token demand: Enterprise integrations that do not require meaningful HBAR usage weaken the valuation link between network activity and price.
- Broader crypto contraction: During sector-wide drawdowns, mid-cap assets typically experience deeper compression. Capital preservation tends to concentrate in larger networks.
Conclusion
From 2026 to 2040, HBAR’s path likely moves through phases of stabilization, compression, rebuild, and selective expansion. Each stage depends on capital participation and the network’s ability to convert activity into measurable token demand. A move toward $1 requires scale. It demands a consistent allocation strength capable of absorbing circulating supply across multiple cycles. Volatility will remain part of that process. For that reason, HBAR should be viewed as a long-term infrastructure exposure. The opportunity exists, but outcomes depend on durable capital commitment and competitive positioning over time.
For more structured crypto outlooks, visit Coin Wicks.
Frequently Asked Questions (FAQ)
1. Can HBAR reach $1?
With about 43 billion tokens circulating, $1 implies roughly a $43 billion market cap. That level has historically been reserved for leading networks. It is possible, but it remains a high-threshold scenario.
2. What could HBAR be worth in 2026?
In 2026, the price is likely to trade within a defined range tied to capital conditions. Stronger participation supports higher levels, while weaker allocation keeps valuation contained.
3. Is HBAR a good long-term investment?
It depends on whether enterprise usage converts into sustained token demand. Long-term outcomes rely on capital cycles and competitive Layer 1 positioning.
4. What will HBAR be worth in 2030?
By 2030, valuation should reflect multi-year adoption and capital depth. Higher bands require consistent demand absorption across cycles.
5. What factors matter most for HBAR price?
Circulating supply, capital participation, enterprise-driven token demand, competitive Layer 1 dynamics, and broader crypto conditions drive long-term price behavior.